Compiling Claude Code: One Minified Bundle, 160 Compiler Fixes
On June 16 the instruction was one sentence: “find the claude code folder and get the (compiled, minified) javascript from there … let's see if we can compile it :D” When the obvious objection came back — that this would be brutal — the answer was the actual thesis: “it's brutal but also a real gut check and wall check, which is why I want to do it. Nothing replaces real-world apps in terms of finding limits.”
A month later, a Perry-compiled binary of Anthropic's Claude Code CLI launches, runs /login through the OAuth flow, streams a real response back from the API, and paints the characters you type. Getting there took 160 pull requests merged into Perry between June 20 and July 17 — a no-op MessageChannel, a missing GC write barrier on RegExp headers, a continue statement that only spun on the real API and never on our mock, and about a hundred and fifty more.
This post is the tour. Not because compiling someone else's CLI is a product — we don't ship this binary and never will — but because it is the single most productive bug-finding instrument we have ever pointed at Perry.
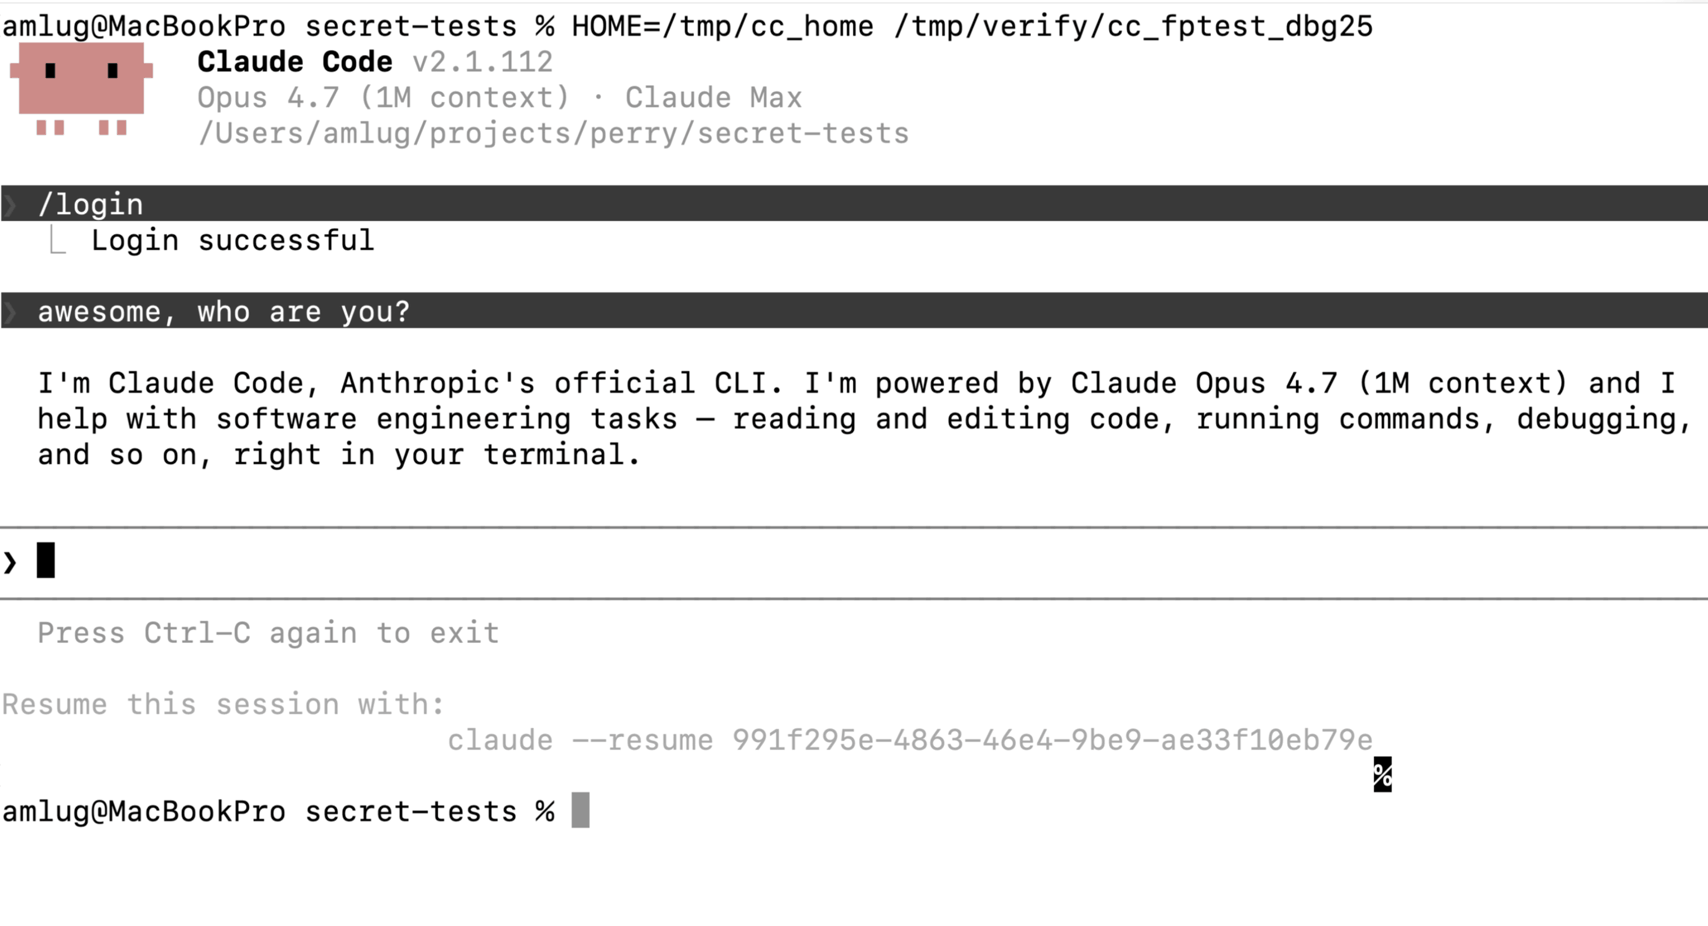
node in that command line. /tmp/verify/cc_fptest_dbg25 is a single native executable produced by perry compile from the shipped cli.js — logging in, streaming a real answer, and exiting cleanly on Ctrl-C.What “compiling Claude Code” actually means
The target is the artifact npm ships. npm pack @anthropic-ai/claude-code@2.1.112 gives you a cli.js: 13 MB of minified, self-executing JavaScript with a #!/usr/bin/env node shebang. No source, no sourcemap, no build step of ours. We point perry compile at that file, unmodified, and ask for a native executable.
Perry chews on it for about 37 minutes and produces roughly 207 MB of IR across 16,023 functions, which link into a ~180 MB binary. Every one of those functions has one-letter names and no type annotations, and the whole thing has to work ahead-of-time — no JIT, no eval, no lazy bail-out to an interpreter when the compiler guesses wrong. If Perry mis-lowers one of those 16,023 functions, there is nothing to catch it.
The scoring ladder comes from our internal stress suite, and it is deliberately unforgiving:
parse    → perry couldn't even parse it
compile  → parsed, but HIR/codegen errored
link     → codegen ok, but cc/ld failed
run      → linked, but the binary crashed / hung / exited non-zero
ran-ok   → binary exited 0
correct  → output byte-matches node --experimental-strip-types
correct is the only tier that counts. Node v26 is the oracle; anything that isn't byte-identical to what Node prints is a Perry bug until proven otherwise.
Why this app in particular
A coding-agent CLI is an unusually hostile pile of JavaScript to compile ahead of time. In one binary you get: React reconciling into a terminal through Ink, a raw-mode stdin reader, an ANSI/emoji-saturated renderer that runs regexes on every frame, a streaming SSE HTTP client, zod schemas built at startup, an OAuth flow, worker_threads, MessageChannel used as a macrotask scheduler, WeakMaps holding fiber state, dynamic require, and a filesystem layer that writes to stdout by file descriptor.
Each of those is a different subsystem of Perry, and the app exercises them together, at scale, under GC pressure, for minutes at a time. Our own test suites — 3,000 Rust unit tests, thousands of TypeScript regression programs, the Node API parity matrix, test262 — are all oriented at pinning known behavior. This bundle is oriented at finding behavior nobody has thought to pin.
The wall chain
The work went in one direction only: clear the current wall, find the next one. Compressed:
| Date | Milestone |
|---|---|
| Jun 21 | --help runs natively, exit code 0 |
| Jun 22 | Real subcommands stop hanging at startup |
| Jun 23 | -p opens an ESTABLISHED TCP socket to api.anthropic.com |
| Jun 24 | zod schemas construct correctly; auth path reached |
| Jun 27 | The TUI renders — logo, welcome box, input frame |
| Jul 9 | First full round-trip: -p against the real API prints the reply, exit 0 |
| Jul 10 | Node-vs-Perry differential harness: 12/12 identical |
| Jul 13 | Byte-identical to Node on -p text + JSON, TUI render, filesystem |
| Jul 16 | Typed characters finally appear in the input line |
| Jul 17 | Full loop validated by hand: launch → /login → API response → typing |
Every fix went upstream as a standalone pull request with a minimal, generic reproduction. None of them mention the app they came from — that was a rule from day one. A Perry user who reads the changelog sees “continue in for-await drivers skipped the iterator advance,” not “we were trying to compile someone's CLI.” The bugs are real independent of the vehicle that surfaced them.
Five bugs worth the trip
1. MessageChannel was a polite no-op
--help worked on June 21. Every real subcommand — doctor, agents, mcp list — hung forever. Not busy: sample showed the process parked, lsof showed no child processes, no sockets, just two pipes.
Perry's MessageChannel installed postMessage as a no-op and onmessage as null. That's harmless right up until you meet the React-scheduler pattern, which uses a message channel as its macrotask scheduler:
const ch = new MessageChannel();
ch.port1.onmessage = flushWork;
ch.port2.postMessage(null);   // schedule the next tick
The message was dropped, the callback never ran, and the event loop idled on its own wakeup pipe forever. #5530 gave ports real same-thread delivery — entangled pairs, a FIFO queue, delivery through the setImmediate macrotask, and a GC root scanner so queued messages survive a collection.
2. One accessor on Object.prototype cost 42 seconds
Before the hang, the same subcommands were CPU-bound for tens of seconds. Profiling pointed at the generic [[Set]] path, and the root cause was a process-global flag.
Perry has a fast path for dynamic property writes, gated on “does Object.prototype currently carry any descriptors?” The bundle installs exactly one accessor on Object.prototype at startup. That flipped the flag process-wide, and from then on every dynamic write in the program took the slow interception walk, which is O(own-key-count). Building a wide object became quadratic:
20,000-property build, clean process:                 16 ms
20,000-property build, after one Object.prototype accessor:  42,394 ms
#5524 replaced the global flag with a per-key question — does Object.prototype have an own property for this key? An absent key can't be intercepted, so the write is safe to fast-path. 42 s → 23 ms, with interception still correct.
Then the same shape reappeared for class instances, which the fast path excluded outright: a 20,000-key build on a plain object took 25 ms, on a class instance 44 seconds. Fixing that one carefully mattered — a naive prototype-chain check would have skipped inherited setters and silently corrupted data — so #5528 resolves the instance's prototype through the class registry and adds an O(1) wide-key index. Back to 30 ms, and linear again.
3. The bug that only the real API could trigger
This is the one we tell people about. By early July the compiled binary would do a complete -p turn against our local mock server: connect, POST, read the SSE stream, print the reply, exit 0. Against the actual Anthropic API it hung forever, every time.
The debugging chain was: a forward-proxy mock proved the full 200 response arrived intact → a replay mock, fed the captured real byte stream, reproduced the hang locally → bisecting the SSE event list found the culprit event → a ten-line reproduction.
The real API sends event: ping frames. Our mock never did. And ping is the one event the SDK's stream loop skips with a bare continue. Perry lowered for await into a driver whose iterator advance sat at the bottom of the loop body:
// what perry emitted
while (!done) {
  ...body...                   // a "continue" here skips the advance…
  result = await it.next();    // …so this never runs. Spin forever.
}

// what it emits now
while (true) {
  result = await it.next();
  if (result.done) break;
  ...body...
}
Six separate lowering sites had the same shape. #6196 moved the advance to the top in all of them. The lesson we keep re-learning: a mock that passes is evidence about the mock.
4. A regex that outlived its own pattern string
The TUI would render, then die of SIGBUS within seconds — 12 crashes in 12 runs under a window-resize stress harness, at different addresses in different functions each time. Weeks of the investigation went into GC theories that A/B testing then refuted, including one of our own “fixes” that turned out to be unsound and had to be withdrawn.
The actual root cause was four lines of Rust. js_regexp_new allocates a RegExp header and stores its pattern and flags string pointers with raw writes — no write barrier. An old-generation object pointing at a fresh young string, with the collector never told about the edge. The minor GC swept those strings out from under a live RegExp, and the next read of the freed slot faulted.
Why did this only show up here? Because a terminal UI is regex-saturated — ANSI parsing and emoji width measurement run patterns on every single frame — so the window between allocation and collection gets crossed thousands of times a minute. Our minimal reproduction, 6,000 regexes plus deliberate allocation churn, never triggered it. The bundle triggered it every time. #6288 added the barrier both fields had always needed.
5. The characters you typed were there. The frame threw them away.
The most stubborn wall: the entire UI painted perfectly — welcome box, input frame, cursor block, status line. Typing / opened the command menu, so the keystroke was reaching React. But the letters never appeared on the input line.
Instrumented builds showed Perry painting the typed character correctly at every stage, and then onRender throwing after the paint — into an Ink try/catch that swallowed it. The frame was abandoned before commit, so every subsequent render built on an empty frame. The app looked completely healthy while ignoring you.
Two independent bugs were hiding behind that one symptom:
#6453 — Perry's inline lowering of
charAt/codePointAt/splitcalled ToString on a non-string receiver without the required coercibility guard. Soundefined.codePointAt(0)quietly returned117— the code point of"u", from the string"undefined"— instead of throwing. A bug that invents plausible data is far worse than one that crashes.#6471 — the real blocker. When an array grows, Perry leaves a permanent forwarding stub at the old address. The minor sweep was reclaiming those stubs while an old-generation parent still pointed at one: the renderer's character cache held a pre-growth pointer on a page that wasn't dirty. Reading through the stale stub produced a garbage length, and every frame aborted. Minors now retain all stubs; full traces reclaim them by mark.
Fixing those exposed a third layer — objects born black during incremental marking were never traced, so anything reachable only through them got swept while live (#6494), and the layout mask under-reported overflow slots so the collector skipped them (#6506). Those two are the kind of soundness holes that produce a one-in-fifty mystery crash in any compiled program. We would not have found them with a test suite.
How you debug a 13 MB minified binary
None of the above is findable by reading code. The tooling that made it tractable:
A differential harness with Node as oracle. Every hypothesis becomes a small TypeScript program run under both
node --experimental-strip-typesand a Perry binary, compared byte-for-byte. It found bugs on its own — a class expression used only as aninstanceofright-hand side was dead-code-eliminated because eleven analysis passes couldn't see through that node type (#6245).Three mock API servers. A logging mock, a forward proxy that captures real response bytes, and a replay server that feeds those exact bytes back deterministically. The replay server is what turned “hangs against production” into a local reproduction.
A PTY harness that answers terminal queries. A dumb pseudo-terminal gets you 50 bytes and a stall. The app probes for cursor position (
ESC[6n), device attributes (ESC[c) and background color (OSC 11) and waits for replies before painting. Answer them and you get the full 3,331-byte welcome screen — and a byte-comparable render between Node and Perry.Link maps for symbolication. Stripped 180 MB binaries produce crash reports full of raw offsets;
ld64 -mapoutput plus a bisect script turns those back into function names.A/B everything. The rule that emerged, written at the top of the handoff notes in capitals: never inherit a theory — test it. Four consecutive root-cause hypotheses for one bug were each refuted by A/B runs. One verifier signal we chased for days (“445 missing old→young edges”) turned out to be a measurement artifact — the check ran between clearing and restoring the remembered set. The code's own comment warned about it.
Where it actually stands
Honestly: it works, and it is slow.
Working today, byte-identical to Node where output is comparable: startup, --help, --version, one-shot -p mode against the real API including error classification and the JSON envelope, the full TUI render, the OAuth /login flow, streaming responses, and typing. Here is the whole loop in one take — launch, /login, a question, a streamed answer, exit:
Two things are still open, and they may well be one thing. Input stops registering after roughly a minute of sustained interactive use — no crash, no error, it just stops. And ESC does not interrupt an in-flight response, though Ctrl-C does now quit cleanly, which it did not do a week ago (that's the exit you see at the end of the recording). A quit path that works while an interrupt path doesn't points at the same suspect as the input death: keypress events that stop reaching the app, rather than anything wrong with the app's own handlers.
The performance picture, measured against Node running the identical bundle, before and after the first round of the speed campaign that started the day correctness landed:
| Metric | Node | Perry (Jul 17) | Perry (after) |
|---|---|---|---|
--version | 328 ms | 1,168 ms | 227 ms |
--help | 715 ms | 5,071 ms | 4,099 ms |
| TUI first paint | 0.76 s | 10.9 s | 8.4 s |
| Keystroke → paint (p50) | 2.2 ms | 111–143 ms | 119–138 ms |
| Memory footprint, idle | 290 MB flat | ~420 MB climbing | ~420 MB climbing |
--version now beats Node, and the win was embarrassing in origin: the compiled executable was exporting 300,281 symbols, so ~80% of that launch was dyld doing weak-definition coalescing. One linker flag took exports to 3 and the binary from 228 MB to 197 MB (#6533). Building each unique regex once instead of twice (#6534) and caching the per-store interception check (#6532, #6541) took the rest.
On that 197 MB, before anyone leads with it: Perry statically links its own runtime and emits machine code for all 16,023 functions ahead of time with nothing to dead-strip — a self-executing bundle makes essentially everything reachable, so there is no cross-bundle DCE to lean on — which means 197 MB is an entire program plus its runtime in one file, against the 138 MB the Node v26 binary weighs before it has read a single line of your JavaScript.
The keystroke row is the one to read carefully, because the “after” number looks worse. It isn't: those are ranges across repeated runs and they overlap, so the median did not move in either direction — that is run-to-run variance, not a regression. It is also exactly what we expected. All three changes touch the link step, regex construction, and the store path; the keystroke median is dominated by the property read path, per-call rooting overhead, and GC steps of 40–80 ms landing inside keypress windows. The proof came in the next round: get/set fast lanes made a field-access microbenchmark 3× faster and moved this number by nothing at all (#6539). A microbenchmark win that doesn't show up in the app is a wrong diagnosis, and we had one.
The memory line is the current campaign. Perry's copying collector can compact — the problem is that it becomes eligible roughly once per 45 seconds of idle, so the nursery regrows to ~300 MB between firings while Node stays flat by compacting continuously. That is a trigger-frequency problem, not an algorithm problem, which is a much better place to be than where we were in June.
None of which is parked. The memory and performance campaign is live as this post goes up — the GC trigger work is running today, on this exact binary — so the performance table above is the part of this post we most expect to invalidate, and the sooner the better. Correctness took a month of walls to get through. What is left is a trigger-frequency problem and a read-path problem, both understood, both already in flight. We expect this thing to feel smooth rather than merely be correct, and we expect it soon.
Why we do this
None of the 160 fixes are about Claude Code. A missing write barrier on RegExp headers corrupts memory in any program that builds regexes under load. for await with a continue spins in any stream consumer. MessageChannel dropping messages breaks every React-scheduler-shaped app. The Object.prototype descriptor flag made every program that touches Object.prototype quadratic in its widest object.
Those bugs were all sitting in Perry while CI was green, while test262 numbers climbed, while the Node parity matrix said 97%. It took thirteen megabytes of somebody else's minified JavaScript, doing real work against a real API in a real terminal, to shake them loose.
We'll keep doing it. The next targets are already queued.
Perry is not affiliated with or endorsed by Anthropic. Claude Code is a trademark of Anthropic PBC. The binary described here was built from the publicly published npm package purely as a compiler test target, and is not distributed.
Gefällt dir dieser Beitrag? Hol dir den nächsten.
Kurze Notizen zu Perry-Releases und woran wir als Nächstes arbeiten.
Ein paar E-Mails im Monat. Jederzeit abbestellbar.